
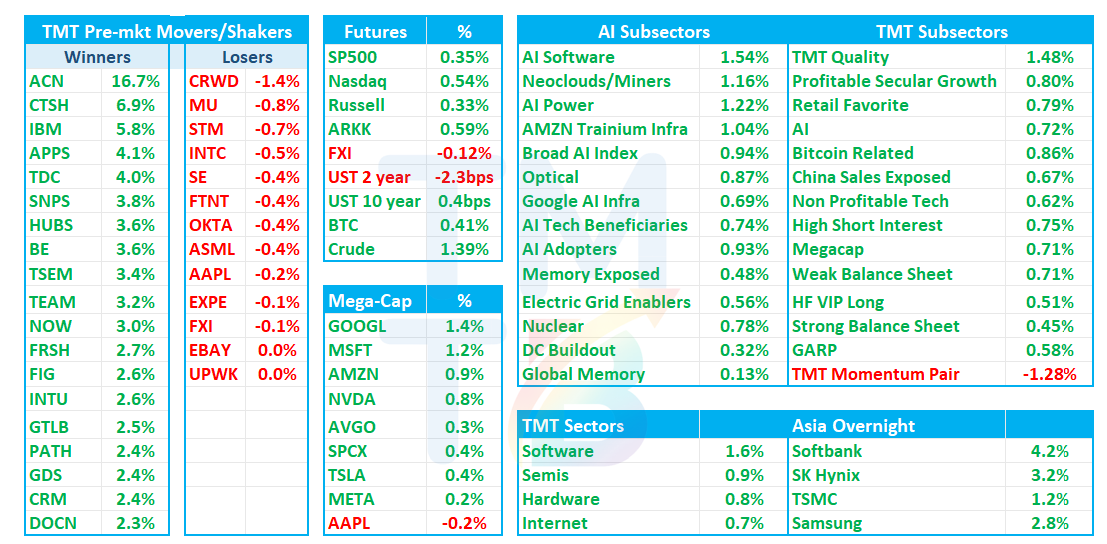
Good morning. QQQs +55bps. Oil +1.4% and yields flattish as macro news pretty quiet overnight.
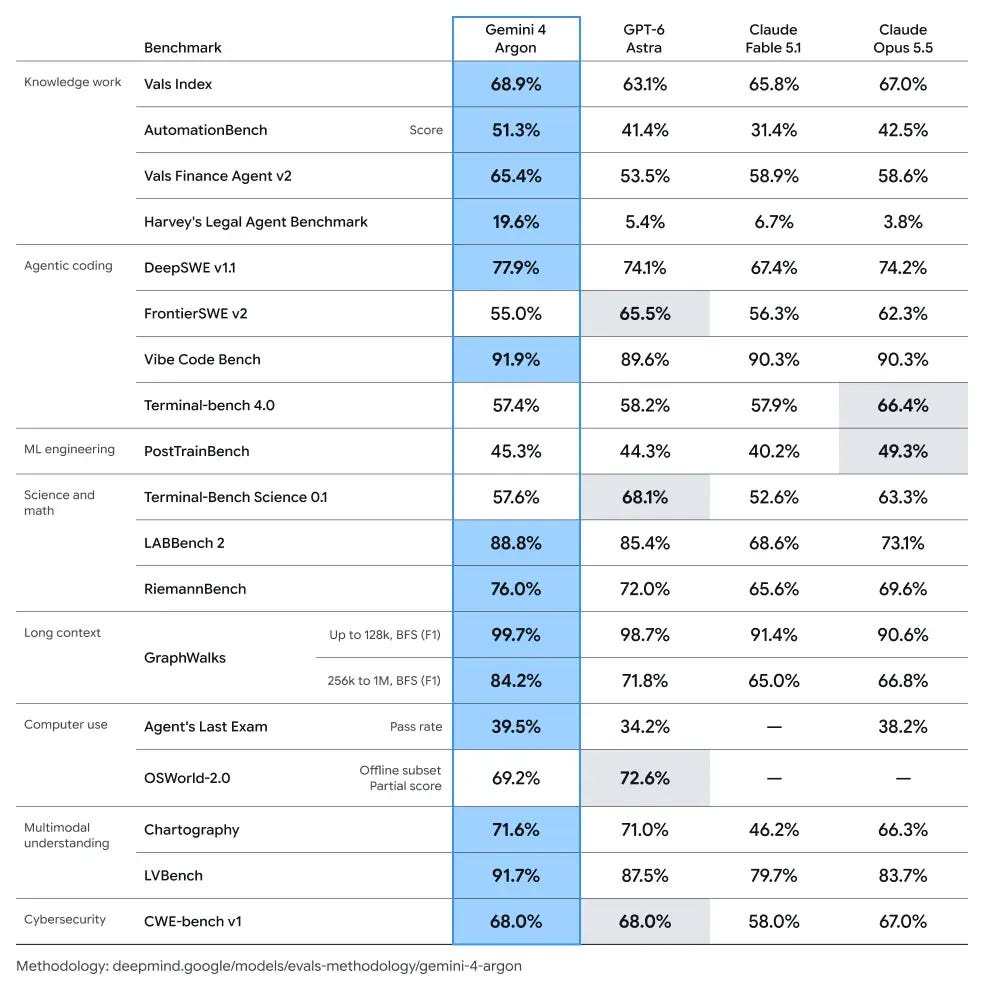
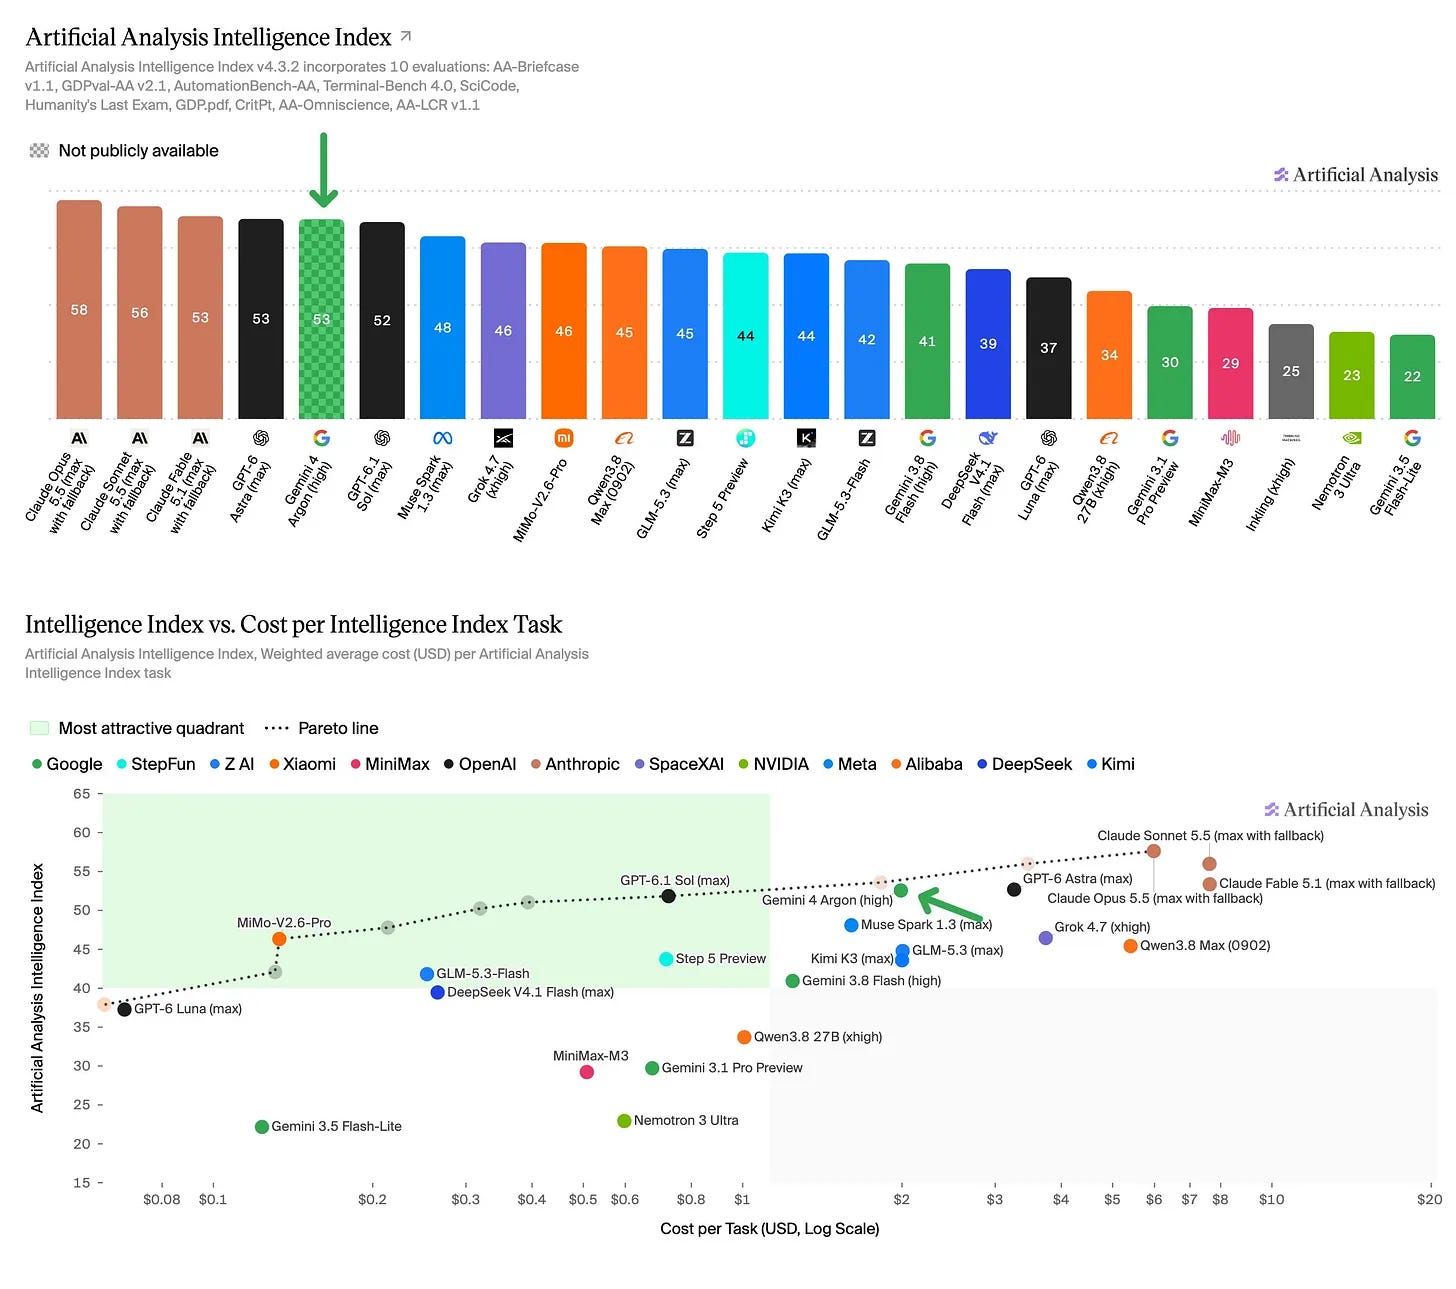
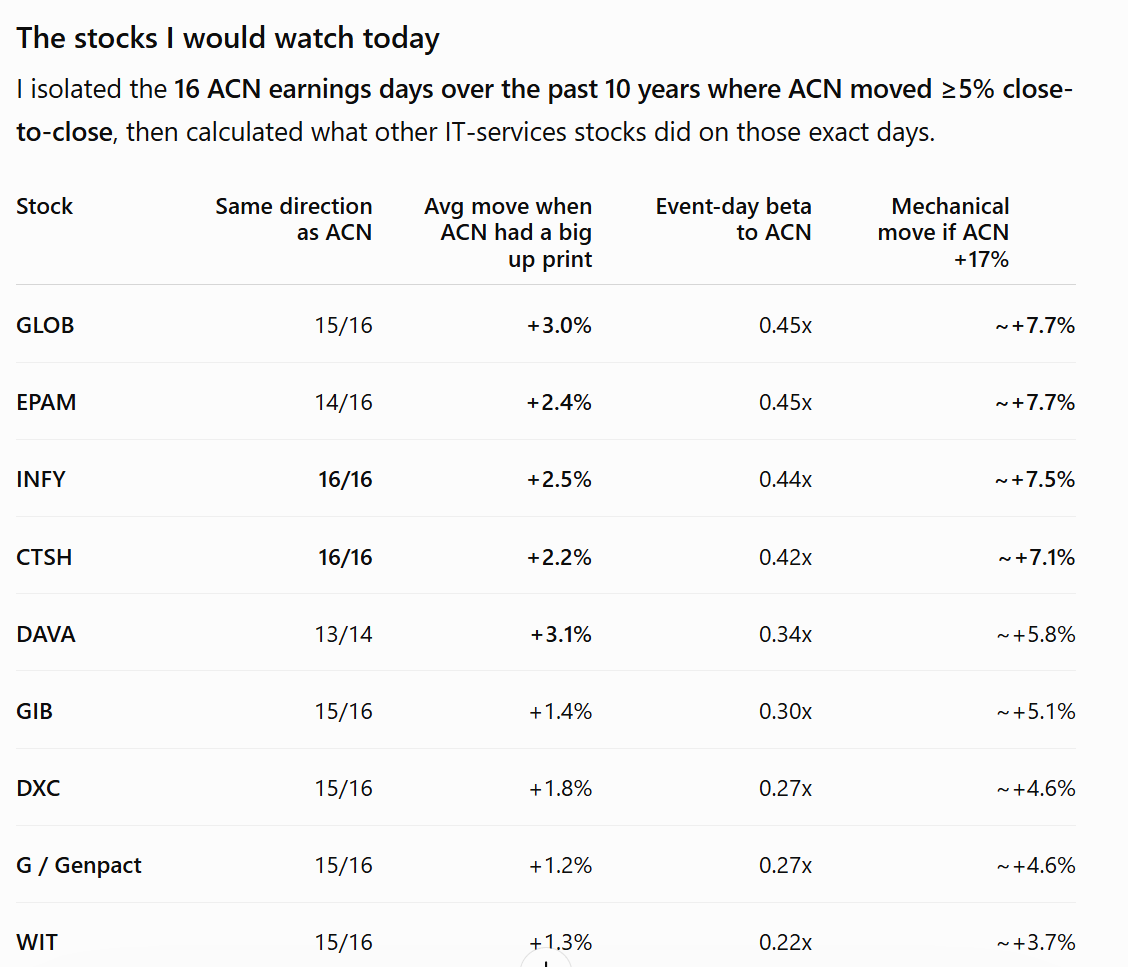
In Tech, Both Semis +1% and Software +1.4% up early. MU flattish despite a nice beat and raise as GM guide was the main nit and print didn’t really resolve any outstanding bull vs. bear debates. GOOGL +1.5% after releasing Gemini 4 Argon, which is near SOTA although investors are focused on when company will come out with their own consumer agent product. ACN +17% following a set of better numbers vs low expectations (IBM +6% ; CTSH +7%) in sympathy, and likely helps the “AI loser” basket today (HUBS +3.5%; FIG +3%, INTU +3% etc.)
Asia mixed overnight: TPX +0.57%, NKY +3.3%, Taiwan TAIEX +0.86%, Korea KOSPI +1.95% Chip stocks higher in Japan (Advantest +9.8%, Lasertec +11.1%, Tokyo Electron +6.5%, etc.). Softbank +4%; Hynix +3%; Samsung +3%
We’ll hit MU and ACN first then move onto the usual. Let’s get to it…
MU: Big revenue/EPS beat and strong FQ1 guide, with gross margin the only real blemish. Tighter supply through 2028 extends the earnings runway, but cost base is resetting higher
MU beat across the board, with FQ4 revenue well above Street and EPS above even the buyside bogey, while FQ1 revenue/EPS guidance also cleared expects. NAND accounted for 2/3 of the rev upside. The one nit is gross margin guide: FQ4 hit the ~87% bogey, but FQ1 guides down to 86.25% vs. ~87-88% buyside, although it’s mainly due to mid-shift to HBM and mgmt said Q1 will be floor for GMs in ‘27. Mgmt expects supply to remain tighter in CY27/CY28 than CY26, with customer discussions increasingly focused on 2028.
A lot of back and forth between investors overnight (you can check out TMTB Slack thread here). Positioning was mixed heading into the print with memory positioning having been reset over the past couple of months. Overall, buyside #s not really moving much with better EPS but GMs weaker (bulls at $200+ for CY2027 EPS). Typical bull vs. bear debate on memory we’ve been hearing over last couple months with bulls pointing to better visibility/LTAs/supply/demand dynamics with potential for big cash returns on a stock trading at ~5-6x while bears will point to uncertainty in ‘28 and beyond. Overall, we think memory continues to be choppy & trending up over time.
The #s:
FQ4 revenue: $54.23B vs. ~$51B Street
FQ4 EPS: $33.42 vs. ~$31.50 Street / $33+ bogey
FQ4 gross margin: 87.0% vs. ~87% bogey
FQ4 operating margin: 82.3%
FQ4 operating cash flow: ~$44B
FQ4 adjusted FCF: ~$33B
FQ1 revenue guide: $60-63B, midpoint $61.5B vs. ~$57B Street / ~$60B bogey
FQ1 EPS guide: $37.15-39.15, midpoint $38.15 vs. ~$36 Street / ~$37.5 bogey
FQ1 gross margin guide: 86.25% vs. ~87-88% bogey
Key Takeaways
Durability. Mgmt sees demand exceeding supply in both CY27 and CY28, even after incorporating new cleanrooms, and says customers continue to request additional supply. More than 75% of 2027 output is committed, including both SCAs and non-SCA purchase orders. The nuance: “tighter than 2026” does not establish that 2028 pricing or profitability will exceed 2027
Contracts. Strategic customer agreements increased to 26 from 16, now covering more than 35% of expected revenue through 2030; the eventual objective remains approximately 50%, not 60–70%. Three-quarters of SCA revenue has a defined pricing framework, a majority of that with floors and ceilings, while the remaining quarter is periodically market-priced. RPO increased 50% to approximately $150B, calculated using committed volumes and minimum applicable prices. New agreements are being negotiated at higher prevailing prices, and some extend into 2031.
HBM. The vast majority of CY27 HBM bit supply is contracted at significantly higher y/y prices, with the reset beginning in calendar 2027. This narrows the profitability gap with conventional DRAM; it does not establish margin parity. HBM revenue grew faster than total company revenue, the customer base expanded, and HBM4 execution remains on track. MU is also co-developing NVHBM, a custom HBM4E implementation, with NVDA.
NAND. NAND accounted for roughly two-thirds of the revenue upside. NAND pricing increased approximately 30% q/q vs. Street approximately 20%, while bits increased approximately 10% vs. 5%. Data center SSD revenue approached $10B, more than 10x y/y and over two-thirds of NAND revenue, supported by KV-cache offload and HDD displacement opportunities. CPU-based agent workloads also broaden the opportunity into LP memory, DDR and SSDs. This is increasingly an investment in the full AI memory hierarchy, not just HBM attached to GPUs.
Cash returns. Adjusted FCF reached $33.2B, approximately 61% of revenue, and mgmt expects November FCF to be significantly higher despite increased CapEx. Importantly, SCA deposits are financing cash flows and do not inflate FCF. MU expects to reach its target cash balance by the end of FQ1 and increase capital returns from December 9, primarily through repurchases. However, the target cash balance and buyback amount remain undisclosed, and only $2.2B remains under the existing authorization. Mgmt did not endorse the $100B-plus return suggested in Q&A. The commitment is to return 100% of excess cash over time, not automatically 100% of annual FCF immediately
Margins. The revenue beat did not translate into equally clean operating leverage. FQ4 GM reached 87.0% vs. Street 86.2%, but OpEx was $2.57B, up 69% q/q, vs. Street approximately $1.68B, reflecting incentive compensation and $300M of community investments. November OpEx is guided to $2.06B vs. Street $1.83B. FY27 OpEx increases another approximately $2.5B y/y, principally for R&D and incentive compensation. The important distinction is that mgmt expects sequential revenue growth each quarter and GMs above November’s floor thereafter.
CFO callback. The post-earnings one-on-one with CFO Mark Murphy covered the incentive-compensation bridge, bit-growth/cost assumptions and SCA coverage. The important modeling takeaway is to separate inventory timing from the ongoing cost reset. Manufacturing compensation accrued in FQ4 principally hits November COGS, but higher FY27 compensation starts affecting manufacturing margins more fully in FQ2, alongside startup costs and depreciation. The approximately $1B of higher November costs is not just a clean one-quarter addback.
Capex/Capacity. FY27 net CapEx is implicitly above $50B: approximately $25B in the first half, with the second half higher. That is more than 80% above FY26’s approximately $27.3B, but mgmt did not provide a precise $55B full-year guide. Most of the increase versus prior plans is construction, primarily accelerating cleanroom availability in late CY28 and beyond, rather than immediately adding equipped wafer capacity. There are earlier additions, including Idaho ID1 and Tongluo in mid-CY27 and Singapore HBM packaging in early CY27. The distinction matters: first output is not full production, and mgmt intends to equip new fabs according to demand.
End markets. Mgmt expects server units to grow high-teens percentages in both CY26 and CY27, with lower memory-content growth than previously assumed enabling more units to ship. That is its answer to de-spec concerns: rationing available memory, rather than a reduction in the underlying need for memory. Consumer demand is less clean. PC and smartphone units could decline double digits in CY26, even as industry revenue grows on premium mix; MU’s mobile/client bits declined sequentially.
Bull vs. Bear Debate:
The broader bull case is that MU and memory is becoming more strategic in the datacenter, gross margins will stay higher for longer given increasing amount of LTAs which should make the stock less cyclical and re-rate it higher, and MU will return an increasing amount of FCF to investors, being able to buyback up to 10% of the float a year. More broadly, MU is becoming less dependent on consumer-device units and more exposed to the memory required to make AI useful, while memory is becoming more strategic in the datacenter and gross margins will stay higher for longer. Training, inference, longer context windows and concurrent agents consume different combinations of HBM, conventional DRAM and NAND. MU therefore does not need to pick the winning model or compute architecture to participate. Physical AI offers additional late-decade demand potential, but the near-term thesis does not require a large robot revenue contribution.
The supply argument is equally important. Higher HBM mix consumes disproportionate wafer resources, future node transitions deliver less incremental productivity per wafer, and new cleanrooms take years to build and additional quarters to ramp. Bulls see that combination allowing pricing strength to persist without requiring another acceleration in AI spending. MU’s leading production nodes, custom-HBM collaboration and expanding customer relationships provide a company-specific execution story on top of that industry backdrop. SCAs then offer a potential bridge from strong current demand to a higher through-cycle earnings floor: committed volumes improve investment planning, pricing frameworks protect part of the business, and new agreements are being written at stronger prices. The repricing catalyst is not simply another EPS raise; it is evidence that profits remain high after customers have more supply options. Cash generation gives bulls a second route to returns even without a dramatic multiple expansion. Mgmt expects to reach its target cash balance shortly and has reiterated the intention to return excess cash.
The bear case is that exceptional scarcity profits are being mistaken for a permanently different earnings model. Customers already have incentives to optimize memory content, use lower-cost tiers and maximize units shipped per available gigabyte. Mgmt’s explanation that de-specing reflects rationing is plausible, but it does not quantify how much HBM content might be removed or how much wafer capacity could ultimately shift back toward conventional DRAM. NVDA’s context-storage architecture illustrates both sides: it expands flash demand while helping customers use expensive GPU memory more efficiently.
SCAs improve visibility, but the disclosed protection is narrower than a casual reading of “75% committed” suggests. That figure refers to 2027 output across both SCA and non-SCA customers. Only three-quarters of the more-than-35% through-2030 SCA revenue has a defined pricing framework, leaving substantial exposure to future market pricing. The contracts have not been tested through a downturn, and $32B of customer financial commitments is not equivalent to $150B of cash collateral or guaranteed profit. The market can reasonably demand evidence that customers honor the economics when spot prices fall.
The cost and supply risks also become more consequential as pricing growth moderates. November demonstrates that higher revenue does not automatically translate into higher GM, while R&D, compensation, startup costs and depreciation are all stepping up. Construction spending does not immediately create bits, but it eventually removes a constraint that currently supports pricing. Meanwhile, premium mix is masking weaker consumer-unit demand, and Chinese competition remains a potential source of global pricing pressure even if MU’s direct China exposure declines. There is already a meaningful split in out-year estimates: bears will model flat FY28 revenue and slightly lower EPS, while bulls assume continued strong growth.
ACN +17%: Clean F4Q beat, bookings rebound and solid FY27 guide push back on the AI-disruption bear case
Expects were low to put it lightly, and ACN beat the high end of its F4Q revenue guide with $18.68B of revenue, +7% y/y in local currency, as both Consulting and Managed Services came in ahead and margins were modestly better than expected. New bookings improved to $22.17B, +5% y/y in local currency after declining 3% last quarter, with Consulting bookings +6% and Managed Services +3%. ACN also repurchased $2B of stock in the quarter.
ACN guided FY27 local-currency growth to +3-6%, roughly bracketing Street expectations, with 10-30bps of margin expansion and EPS essentially in line at the midpoint. F1Q revenue guidance also brackets Street, while +2-6% LC growth implies some deceleration from F4Q’s +7%. Overall, not a huge estimates reset, but a clean print with bookings and demand better than feared.
Key KPIs vs. Street
Revenue: $18.68B, +6.2% y/y reported / +7.0% LC vs. Street $18.04B; guide was $17.75-18.40B
Consulting revenue: $9.28B vs. ~$9.0B Street
Managed Services revenue: $9.40B vs. ~$9.2B Street
Operating margin: 15.3% vs. Street 15.2%
EPS: $3.29 vs. Street $3.19
Bookings: $22.17B, +4% y/y reported / +5% LC; Consulting $9.4B +6%, Managed Services $12.77B +3%
F1Q27 revenue: $18.95-19.60B vs. Street ~$19.4B
F1Q27 LC growth: +2-6% vs. Street ~+3.8%
FY27 LC revenue growth: +3-6% vs. Street ~+4.0%
FY27 operating margin: 15.9-16.1%, +10-30bps y/y vs. Street 15.9%
FY27 EPS: $14.39-14.81 vs. Street $14.62
FY27 FCF: $11.0-11.8B vs. Street ~$11.6B
Cash returns: At least $9.5B vs. $11.5B returned in FY26
TECH RESEARCH/NEWS
GOOGL: Releases SOTA model Gemini 4 Argon
Gemini 4 Argon carries “introductory” pricing of $2 per 1M input tokens and $10 per 1M output tokens, well below Claude Fable 5.1 at $10/$50 and Claude Opus 5.5 at $4/$20. Its maximum output length also increases to 1M tokens from 64K previously, versus 128K for both Claude Fable 5.1 and Opus 5.5.