


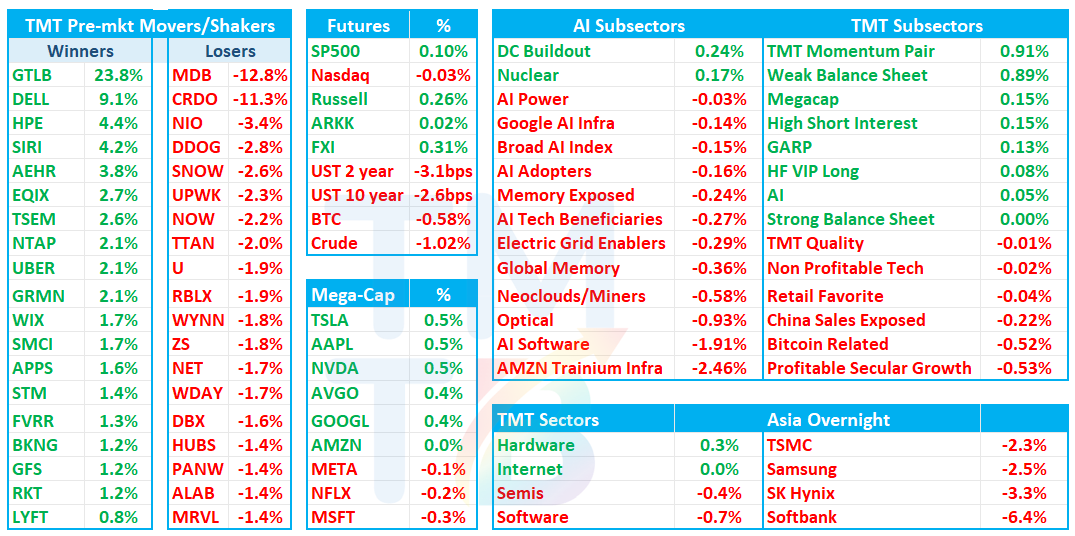
Good morning. Futures flat. Yields ticking down 3bps across the curve while Oil is down slightly.
In Tech, DELL +9% and GTLB +23% delivered the goods while MDB -13% & CRDO -11% missed elevated expectations. PANW -2% the most debated overnight among investors. We’ll dive into DELL GTLB MDB and PANW then move onto the usual. We’ll put some CRDO Bull vs. Bear Takes in the Slack as soon as we’re done here. Semis -70bps and Software 40bps both down early.
Asia weaker overnight: TPX -2.4%, NKY -2.85%, Hang Seng -0.07%, HSCEI -0.15%, SHCOMP -0.97%, Shenzhen -1.45%, Taiwan TAIEX -1.67%, Korea KOSPI -3.99%. Softbank -6%; Hynix/Samsung -3%
Let’s get straight to it…
DELL +8%: Another big rev and EPS guidance raise; AI pulls the whole stack as $61B of orders, storage-led margins and a $25B FY27 raise
AI-server revenue $74B, above bogeys of $70B and street in mid 60s. FQ2 revenue/EPS of $46.97B/$7.04 came in above Street at $44.93B/$4.91, while FQ3 and FY27 midpoint guides of $49.0B/$6.50 and $192B/$25.50 were far above Street at $41.36B/$4.47 and $174.13B/$18.95 and bogeys of low 20s (buyside was already sitting at $25 for the year)
AI server revenue of $16.4B was only modestly above Street, but traditional servers grew 122% and storage grew 26%, driving ISG revenue up 89% and ISG OM to 15%. AI orders jumped to $60.9B and backlog to $95B, while the five-quarter pipeline still grew sequentially and remains multiples of backlog after $131.7B of orders over the past year
Overall, not much to nitpick at the results as bulls come away happy with the huge beat, but bears will question how much of that broader growth and margin structure survives once component inflation, supply scarcity and initial enterprise refresh normalize.
Key Takeaways:
Callback. The most important callback clarification was that 15% ISG OM should not be annualized. Mgmt expects approximately 13.5% in FQ3 and modest sequential improvement in FQ4, while AI server OM should remain in the mid-single digits through upcoming platform transitions. CSG OM is expected to normalize toward roughly 6% in FQ3 and 5.5% in FQ4, supporting a structurally better margin framework, but tempering the most aggressive extrapolations from FQ2.
Enterprise. DELL’s AI customer count surpassed 6,500, up from roughly 5,000 last quarter. Of those, 3,300 were added during the past three quarters, versus eight quarters to acquire the first 3,200. Enterprise customer count, repeat buyers, revenue and pipeline all increased sequentially and y/y. However, mgmt explicitly said the overall mix did not necessarily change because sovereign and large-neocloud wins also remained strong, so concentration risk is improving but not disappearing. Enterprise customers also tend to attach more storage and networking.
Servers. Traditional server and networking revenue reached $10.53B, +122% y/y versus Street around $9.3B, +~96%, and FY27 growth is now expected to exceed 100% versus the prior outlook of just over 60%. Most demand is coming from DELL’s historical enterprise base, supported by data-center modernization, higher core and memory content, security and resiliency requirements, and incremental CPU demand for agentic workloads. DELL gained more than 10 points of traditional-server share over the past two quarters.
Refresh. Approximately 1.2M installed assets remain on 14G or older platforms. Mgmt sees 6–8:1 consolidation ratios on 17G and 12–14:1 on the upcoming 18G platform, with post-quantum cryptography and heightened security becoming additional forcing functions. This provides a concrete multi-year refresh argument beyond near-term memory pricing.
Storage. Storage revenue was $4.85B, +25.8% y/y versus Street around $4.3B, +~11.5%, and FY27 growth is now expected in the mid-teens. Dell-IP demand has grown ahead of the market for six consecutive quarters, with mix shifting away from lower-margin partner IP toward higher-margin proprietary products. AI is adding demand from unstructured data, agents, logs, traces and KV cache, but Lightning remains early and is still in beta at several customers, meaning the current strength is primarily coming from the established Dell-IP portfolio rather than a fully mature AI-storage product cycle.
Margins. Gross margin was 21.1% versus Street 17.4%, total OM was 12.6% versus Street 9.3%, and ISG OM was 15.0% versus Street approximately 11.0%. Scale and operating leverage were the largest contributors, followed by higher Dell-IP storage mix, pricing discipline and favorable product, customer and geographic mix. Mgmt cautioned that every FQ2 benefit will not persist at the same level, but also argued that the multi-year modernization program has structurally lowered the expense base.
Pricing. Mgmt explicitly acknowledged that inflation and input-cost increases are contributing to revenue growth, but did not quantify the price-volume split. One detailed decomposition estimates that traditional-server growth included approximately 25% more CPU cores, 40% like-for-like pricing primarily from memory inflation, and 27% more non-CPU content per core. The magnitude of the pricing contribution remains one of the most important questions around revenue quality and the eventual growth comparison when memory prices stabilize.
Supply. Demand continues to exceed available supply across DRAM, NAND, CPUs, disk drives, optical components, substrates and power equipment. DELL attributed the $25B FY27 revenue increase partly to better allocation and configuration of available components, including redirecting supply from a softer second-half CSG environment toward ISG. Large customers are ordering further in advance and sharing longer-term requirements to secure supply. This creates additional shipment upside if supply improves, but also raises the eventual pull-forward and double-ordering debate.
CSG. CSG revenue was $15.03B, +20.2% y/y versus Street $14.99B, +~19.9%; commercial grew 22% and consumer grew 7%. FY27 CSG growth is now expected in the mid-teens, but the setup is less clean than ISG: large-enterprise refresh activity remains healthy, while more cost-sensitive customers are extending replacement cycles and FQ3 OM is expected to fall toward 6% as DELL balances units, pricing and share.
Bull vs. Bear Debate
Bulls believe DELL is evolving from a cyclical hardware vendor into the scaled merchant platform for enterprise and neocloud AI infrastructure. The $95B AI backlog alone exceeds one-half of the new FY27 revenue guide, while the more important five-quarter pipeline continued to expand after $131.7B of orders were booked over the past year. The customer base is also broadening: enterprise customer additions have accelerated sharply, repeat purchases are increasing, and enterprise buyers attach more storage and networking than large standalone neocloud deployments. That expands both the addressable market and the margin pool.
The broader portfolio is central to the bull case. AI is stimulating not only GPU-server demand, but also traditional CPU compute for agentic orchestration, storage for logs, context and KV cache, networking, services and financing. Traditional servers growing 122%, storage growing 26% and ISG OM reaching 15% materially weaken the old bear argument that DELL’s AI exposure is merely high-revenue, mid-single-digit-margin server assembly. Dell-IP storage mix, more complex rack-scale deployments and greater enterprise attachment create paths to structurally higher gross profit dollars even if standalone AI server margins remain modest.
Bulls also see durable execution advantages. Some AI engagements require more than 50 unique designs across workload performance, power, cooling and the data-center environment. DELL combines engineering, supply-chain scale, global deployment and support, financing, and the ability to move customers from initial design to first token. Those capabilities matter more as systems transition from individual GPU trays toward full rack-scale solutions. This quarter’s share gains, ability to redirect constrained components and position as an early Vera Rubin rack supplier reinforce that differentiation.
Bears argue that headline growth overstates underlying unit demand. Mgmt acknowledged that systems cost more than they did in prior quarters and that inflation is embedded in growth. Roughly 40 percentage points of traditional-server growth is bc of like-for-like pricing, in addition to richer memory and storage configurations. If memory prices flatten or fall, DELL could face slower revenue growth even if unit demand remains healthy. The extraordinary growth comparisons may therefore reflect a mix of true modernization, richer configurations, price increases and customer pull-forward rather than a clean doubling of underlying compute demand, and eventually leading to much tougher comps in ‘28.
The order and backlog figures also require judgment. Supply-constrained customers are ordering earlier and sharing longer-duration forecasts to secure components. That provides visibility, but it can create double ordering, project timing risk and eventual digestion. Large dollar deployments remain concentrated among a relatively small group of neocloud and sovereign customers, whose financing capacity and project schedules may be less durable than those of hyperscalers. DFS helps DELL close and finance deployments, but rising financing receivables add working-capital and credit exposure. The customer-count diversification is encouraging, yet mgmt explicitly said the overall mix did not necessarily change.
Margins are the second major bear argument. FQ2’s 15% ISG OM benefited from unusually favorable scale, storage mix, pricing, geography, customer and product mix, and mgmt does not expect all of those benefits to recur. The callback’s approximately 13.5% FQ3 ISG margin and more normalized CSG margins show that FQ2 is not the new quarterly run rate. Meanwhile, AI servers remain a mid-single-digit-margin product, and the mix of lower-margin AI revenue continues to expand. Reported FCF of approximately $1B was also far below adjusted FCF because of DFS dynamics, while inventory rose 41% q/q. Bears will want evidence that earnings growth converts consistently into reported cash rather than financing receivables and inventory.
Longer term, the risk is that FY27 represents a peak growth and pricing year. Traditional-server demand could normalize after the refresh wave, storage attachment may develop more slowly than expected, PC units may remain weak, and public-cloud or ODM alternatives could pressure pricing. DELL’s multiple has already expanded well above the roughly 10x historical forward P/E it used to trade, mean any slowdown in growth or margin disappointment re-rates it back.
MDB: 30% total growth was not enough; 29% Atlas, weaker Q3 guide, and an implied F4Q slowdown drove the selloff
Sentiment & positioning had sneakily increased into the print and F2Q27 was strong across revenue, EPS and margins, & FY27 was raised by more than the quarterly upside, but main KPI 29% Atlas growth fell short of buyside bogeys closer to 30%+ and guide implies Q4 Atlas growth of only 24% in Q4 as AI remains too small to drive an immediate acceleration.
Bears will say no accel and slower growth than DDOG/SNOW at similar multiple and expectations were high heading in. Bulls will say the 26% Q3 Atlas guide is conservative and likely comes in near 29-30%, which means no signs of decel and keeps accel hopes alive while at the same time giving some breathing room for AI revs to finally pick up. Overall, q unlikely to have bulls jumping ship but stock likely needs some digestion after recent run.
The #s:
Revenue: $771.8M, +30.5% y/y (last q +25.2%) vs. Street $733–735M, +~24%.
Atlas / EA: Atlas revenue was $565.9M, +28.9% y/y (last q +29.4%) vs. Street $553.4M, +26.1%, but below the 30%+ buyside bogey; EA & Other subscription revenue was $181.2M, +35.9% vs. Street $158.2M, +18.6%.
Non-GAAP EPS was $1.90 vs. Street $1.61–1.62, while non-GAAP operating margin reached 24.1% vs. Street 21.1%.
Guide: F3Q27 revenue midpoint is $758.5M, +20.7% y/y vs. Street $747M, +18.9%; FY27 midpoint is $3.01B, +22.2% vs. Street $2.967B, +20.4%. FY27 Atlas growth was raised to ~27% vs. Street 24.5%, although that implies F4Q Atlas growth of only ~24%.