


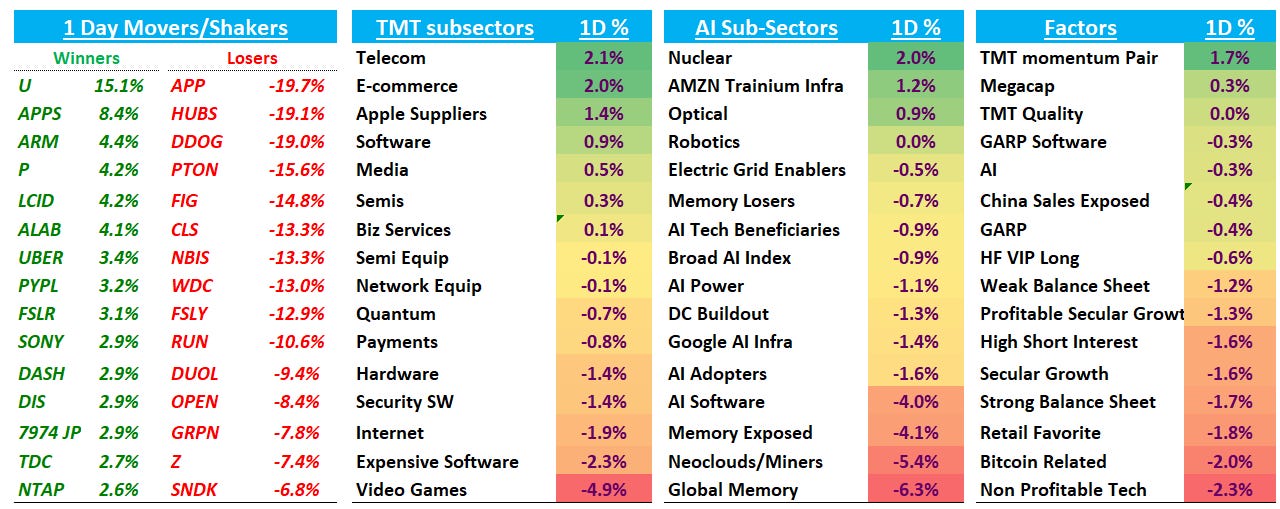
Good afternoon. QQQs -40bps on the day. Last night & this morning was a rough night for TMT earnings but this afternoon is looking a lot better so far with strong prints across the board, particularly in software as TWLO, NET & TEAM all put up great numbers. AKAM, MHCP & ABNB look solid too. Pretty solid session today despite the negative prints, the spike in yields (4-6bps) and oil (+4%), and news that Hormuz pact won’t immediately and completely reopen the waterway, w/Tehran potentially barring ships associated with the US and Israel. Our base continues to be choppy but up in August.
We’ll dive into first takes (NET TEAM AKAM MCHP LYFT TWLO) then get into the usual EOD wrap.
Let’s get straight to it…
POST-CLOSE EAERNINGS
NET +17%: Looks really good with total revs accelerating to 36% vs 33.5% last q despite a tougher comp. 4.5% beat is biggest since Q4’21. Guide implies a decel to 31%, but if you assume 4% beat gets you flattish growth despite the tough 4% comp. RPO accel’ to 38% vs 36.5% last q. Stock hitting new highs in the post - seems like game on again.
TEAM +32%: A very good looking print, with the biggest positive coming from Cloud. F4Q revenue beat Street by ~7%, while Cloud growth of 31% landed ~1.5–2pts above buyside expectations. F1Q better as well: revenue guidance came in above Street and 28.5% Cloud growth was well ahead of ~22–23% buyside bogeys. RPO +44%. FY27 revenue growth guidance of 13% is slightly below Street, but should be looked through as secondary. “Up to $250M” founder repurchase plan. Not much to pick at here
Key KPIs vs. Street
F4Q Revenue: $1.77B vs. Street $1.66B
Cloud Growth: +31% y/y vs. buyside ~29.5%
F1Q Revenue Guide: $1.71B vs. Street $1.67B
F1Q Cloud Growth Guide: +28.5% y/y vs. buyside ~22–23%
FY27 Revenue Growth Guide: +13% y/y vs. Street ~14%
FY27 Cloud Growth Guide: +25.5% y/y
AKAM +13%: Mixed quarter/guidance on the core numbers, with Q2 revenue/EPS essentially in line and Q3/FY revenue bracketing Street, but the stock up on continued CIS momentum and another major AI infrastructure win: a new >$600M four-year contract, bringing YTD multi-year CIS contract value to >$2.8B. Given the turning of the ROI narrative on spend, should be good enough.
Q2
Revenue: ~$1.10B vs. Street $1.09B
EPS: $1.59 vs. Street $1.57
Security: $604.4M vs. Street $600.1M
Delivery: $395M vs. Street $389.7M
Cloud Infrastructure Services: $99.3M, +39% y/y vs. Street $103M
Gross Margin: 71.0% vs. Street 70.4%
Adjusted EBITDA: $416M vs. Street $421M
EBITDA Margin: 37.8% vs. Street 38.6%
Q3 Guide
Revenue: $1.105–1.130B vs. Street ~$1.13B
EPS: $1.60–1.80 vs. Street $1.70
FY26 Guide
Revenue: $4.445–4.530B vs. Street ~$4.50B
EPS: $6.40–7.05 vs. Street ~$6.70
MCHP +14% Clean beat-and-raise with modest top-line upside but a much stronger margin/EPS guide; 330bps of C3Q GM upside is the standout and suggests pricing/mix are working in MCHP’s favor. Against a backdrop of somewhat underwhelming analog prints and MCHP being a lesser owner name, this should reinforce the recovery story.
C2Q Revenue: $1.485B vs. Street $1.460B
C2Q Gross Margin: 63.8% vs. Street 62.7%
C2Q EPS: $0.76 vs. Street $0.70
C3Q Revenue Guide: $1.603B vs. Street $1.550B
C3Q Gross Margin Guide: 66.5% vs. Street 63.2%
C3Q EPS Guide: $0.93 vs. Street $0.80
PR: "Our June quarter financial performance demonstrates the strength of our operating model and the significant leverage embedded in the business as revenue recovers. Higher factory utilization, lower underutilization charges, and disciplined expense management drove meaningful sequential improvements in profitability and cash generation during the quarter. We also continued to strengthen our balance sheet and improve financial flexibility by reducing net debt by approximately $170 million during the quarter.”
TWLO +16% Looks good with strong beat-and-raise: Q2 revenue/EPS $1.50B/$1.47 vs. Street $1.43B/$1.32, with organic growth accelerating to 17% vs. 10–11% guide and GM/OPM of 49%/19% vs. 48.4%/18.1%;
Q3 revenue/EPS guide $1.505–1.515B/$1.42–1.47 vs. $1.47B/$1.40, while FY26 revenue growth was raised to 18–18.5% and organic growth to 13–13.5% from 9.5–10.5%, with FCF raised to $1.135–1.155B.
LYFT +1%: Solid beat across bookings, revenue, EBITDA and FCF with record riders/rides and healthy Q3 growth guidance; little to push back on outside of EBITDA margin being roughly in line.
Q2 beat with strength across growth and profitability. Gross Bookings grew 23% y/y to $5.50B vs. Street $5.37B, revenue grew 16% to $1.84B vs. $1.82B, and adjusted EBITDA increased 37% to $177M vs. $170M. Operating metrics were also modestly ahead, with record Active Riders of 30.5M (+17% y/y) and Rides of 262.4M (+12% y/y), while FCF of $320M was well above Street. EBITDA margin on bookings was essentially in line at 3.2%. For Q3, LYFT guided Gross Bookings to $5.50-5.67B (+15-19% y/y) and adjusted EBITDA to $183-203M, while highlighting continued rides/bookings acceleration, >$1B of TTM FCF, and growing contribution from partnerships/AV initiatives.
EOD WRAP
AI/SEMIS
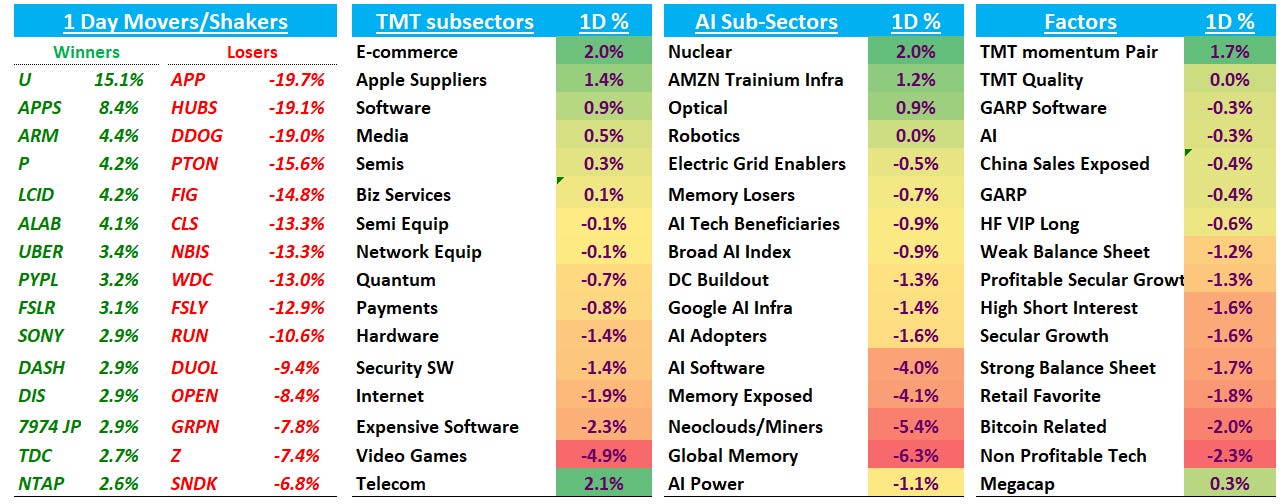
NBIS -13% as investors worried about the 300MW vineland DC (in partnership with DataOne): a packed Wednesday evening planning-board hearing, moved from City Hall to a local theater to handle the crowd, turned contentious as residents voiced strong opposition over lack of transparency, heavy water and power use, noise, air quality, and broader quality-of-life/property-value impacts, with no final decision yet on the expansion and investors fearing community pushback could slow this critical growth site. Michael Burry also disclosed he had shorted the stock at $211.77 “in somewhat larger size,” framing it as part of his broader bearish view on AI-infrastructure names involving off-balance-sheet liabilities & uncommenced leases that he said made certain stocks look like “shooting fish in a barrel.” CRWV -5% in sympathy