


Not a good start to tonight’s Tech earnings.
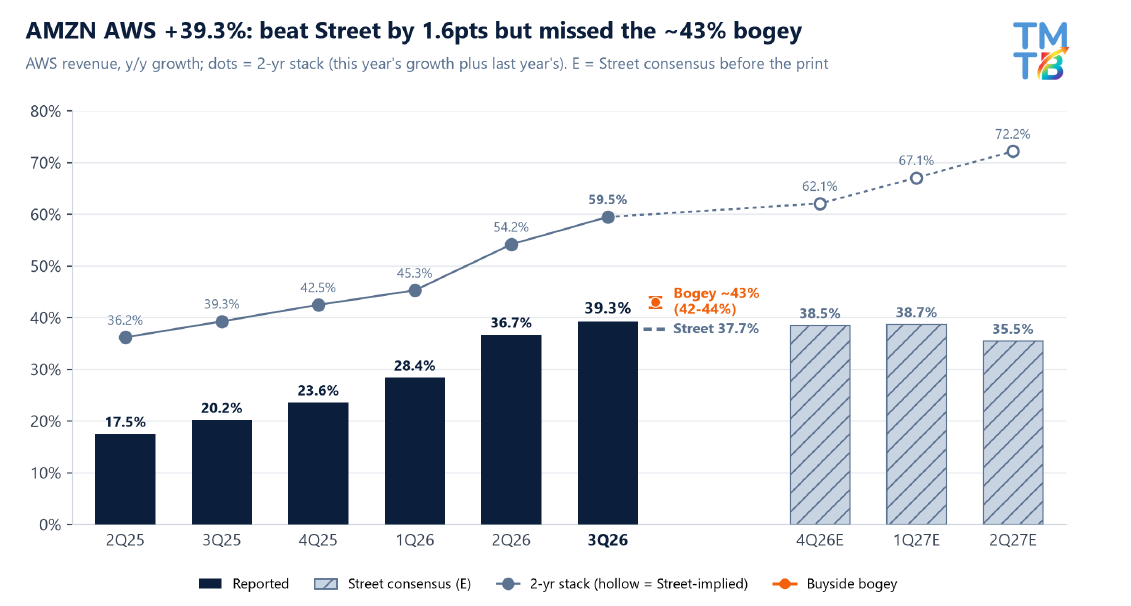
AMZN -11%: AWS +39.3% beat Street (37.7%) but missed the ~43% buyside bar, with 38.7% OM vs. the ~40% bogey, and the 4Q guide’s high ends ($247B revenue / $33.5B OI) were light vs. the ~$247-248B / ~$34-35B bogeys, with both midpoints under Street. 3Q cash capex of $75.9B took TTM FCF to -$42.4B; the offset is Jassy projecting AWS growth of “over 40% both in 2027 and in 2028”.
Crowded long so bulls not happy tonight and today’s -4% only took a bit of air out; a 39% AWS with OM down q/q isn’t what longs who wanted 43%+ and a 4-handle were looking for. Bulls get the 40%+ AWS outlook for 2027-28, bears get a $76B capex quarter, an ads miss and the funding question.
AWS beat Street but missed the bogeys at $46.0B, +39.3%, vs. Street $45.45B (+37.7%) and bogeys around ~$47.2B (~43%, range 42-44%).
That’s a +$3.75B q/q add vs. the record +$4.6B in 2Q, and a 2.6pt accel from 2Q’s 36.7% on a 20.2% comp; 2-yr stack 59.5 vs. 54.2 in 2Q.
AWS OM 38.7% ($17.8B OI), ~136bps above Street’s 37.3% but ~135bps below the ~40% bogey and ~70bps below 2Q’s 39.4% (which had a ~$0.6B energy-derivative gain; ~38.1% ex).
Incremental OM 49% y/y, but only 31% q/q.
Run rate $184B vs. $169B in 2Q. Backlog and the AI / chips run rates are not in the release (2Q: $496B backlog; “over $25 billion” each).
The 2027-28 projection vs. Street: FY27 Street AWS $236.0B is ~+35% on ~$175B FY26 (YTD $125.8B + Street 4Q $49.3B); 40% on that base is ~$245B, ~$9B above Street.
New AWS agreements with META, NVDA, OpenAI, CRM and ORCL among others; Bedrock token volume up nearly 17x y/y.
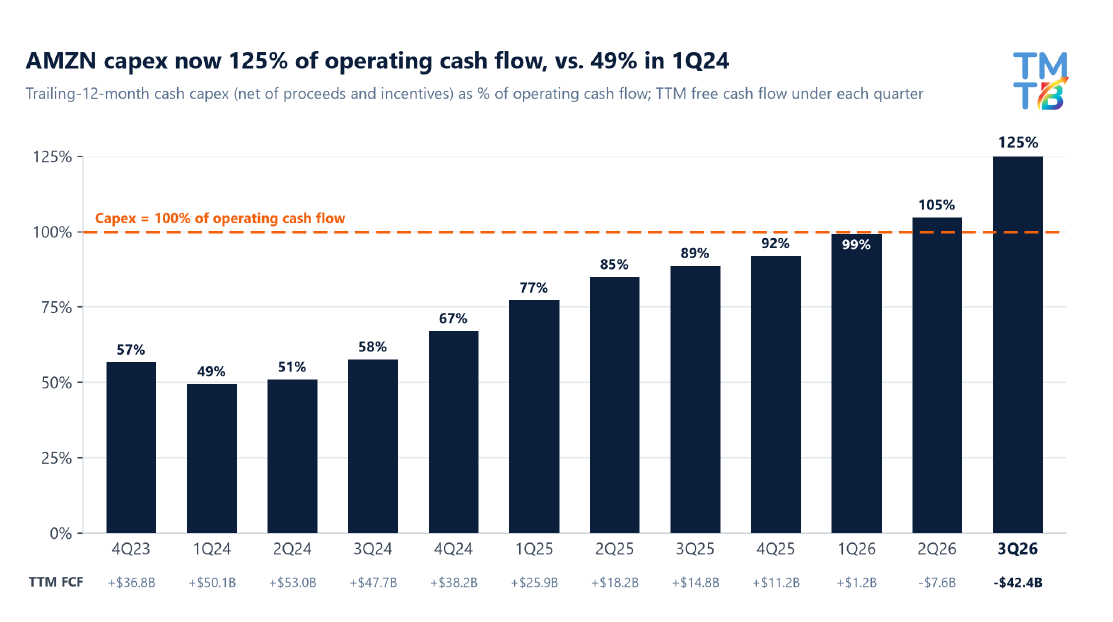
Capex ran $75.9B in 3Q (cash, net of proceeds, +122% y/y; $77.3B gross) vs. Street $58.2B on the same net basis and $53.1B in 2Q.
“We continue to expect 2026 cash capital expenditures to be approximately $220 billion.” YTD is $172.2B, which implies ~$47.8B for 4Q vs. Street $64.8B.
The unpaid-P&E build slowed to +$0.9B from +$10.7B in 2Q, so more of the spend hit cash this quarter.
FCF was -$33.5B for the quarter (OCF $42.4B less $75.9B) vs. Street +$1.3B; TTM FCF -$42.4B vs. -$7.6B in 2Q.
Funding so far is debt: $48.1B of long-term debt raised in 3Q (LT debt $173.1B vs. $65.6B at YE25). Also $24.0B of acquisitions / non-marketable investments in the quarter ($63.8B YTD).
Nothing on 2027 in the release; remember bogeys around ~$325-350B vs. Street ~$287B.
Revenue missed at $201.9B, +12.1% (13% ex-FX), vs. Street $202.35B and ~$202.5-203.5B bogeys, just under the $202.0B high end of the $197-202B guide.
Ex the Prime Day shift the company says growth would have been ~400bps higher; 2Q+3Q combined +15.7% vs. Street 15.8%.
North America $112.9B (+6.2%) missed Street’s $113.8B mean (+7.1%) but was in line with the ~6-6.5% bogey and the $113.2B median; 2Q+3Q combined NA growth 11.0% vs. ~12% in 1Q.
International $43.1B (+5.4%, +8% ex-FX) in line with Street $43.0B.
Ads missed at $19.6B, +10.9% (12% ex-FX), vs. Street $20.9B (+18%); 2Q+3Q combined +18.1% vs. Street 21.9%.
The release blames “timing anomalies primarily related to Prime Day (and a couple other timing factors)” and expects 4Q ads to “grow in the high teens” (Street +18.7%).
Keeps the agentic-ads debate front and center; Alexa for Shopping was used by 400M+ customers in the last 12 months, interactions +570% y/y.
EBIT beat at $28.1B / 13.9% OM vs. Street $26.2B, the $22.5-26.5B guide and ~$27.5-28B bogeys; a record OM, +~21bps q/q.
That’s ~$1.6B above the guide high end and +61% y/y vs. $17.4B (a base hit by the FTC settlement and severance charges).
NA OI $8.7B (7.73% OM) vs. Street ~$7.7B (6.8%), ~93bps above; International $1.6B (3.67%) vs. ~$1.8B (4.1%), ~42bps below.
GAAP EPS missed at $1.89 vs. Street $1.97 despite the OI beat: non-op swung to -$1.2B (interest expense $1.69B vs. $0.54B a year ago, other expense $0.7B), with no Anthropic gain vs. $9.5B a year ago.
4Q guide light vs. the bogeys, midpoints under Street: revenue $240.0-247.0B (+12-16%) vs. Street $244.4B and ~$247-248B at the high end; OI $28.5-33.5B vs. Street $32.9B and ~$34-35B at the high end.
Revenue midpoint $243.5B = +14.1%, a 2pt accel vs. 3Q’s reported +12.1% (Prime Day-distorted) but below the 15.7% 2Q+3Q combined pace, on a 13.6% comp; 2-yr stack 27.7. FX ~60bps headwind.
The ranges widened to $7B on revenue and $5B on OI (vs. $5B / $4B for 3Q).
OI midpoint $31.0B = +24% y/y vs. $25.0B; implied FY26 OI ~$110.4B.
INTC -18%: 3Q beat Street on revenue, GM and EPS, with 44.1% GM and $0.52 EPS clearing the bogeys and DCAI +78%, but the Dec guide whiffed: revenue of $15.0-16.0B and 38.0% GM vs. $16.98B / ~42.5% Street and ~$17.7-18B / ~44% bogeys, with the CFO seeing the PC slowdown run at least through 1H27. Crowded long, so LBT has a lot to explain on the call.
Crowded long coming in (even after the ~28% pullback from the 9/24 high), and the buyside was well above Street on Dec, so a guide down 6% q/q with GM back to 38% is a big disappointment. Bulls will point to DCAI, but the PC slowdown is the story tonight.