

TMTB Morning Wrap

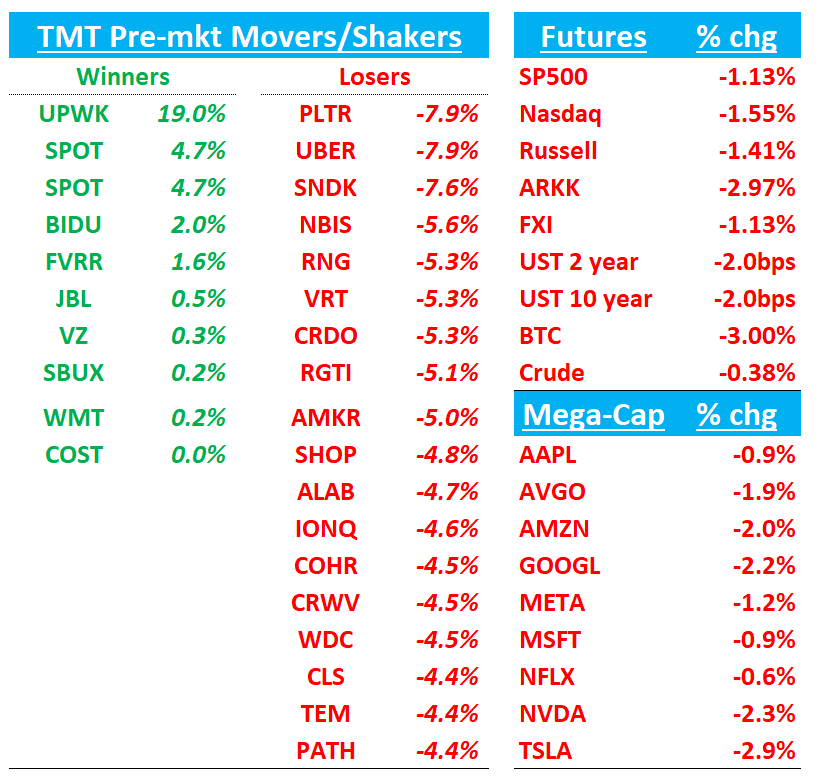
Good morning. Futures in the red to start the day -1.5% as risk off dominating. Some negative price action early following earnings, with PLTR -8% despite another big beat and raise with accel across the board. Price action on these names will be especially important to watch as tea leaves of further mkt weakness (down on good news). QQQs bumping down against the 10d right now and below ~625/626 level would be lower lows.
Asia was weak overnight: TPX -0.65%, NKY -1.74%, Hang Seng -0.79%, HSCEI -0.92%, SHCOMP -0.41%, Shenzhen -1.34%, Taiwan TAIEX -0.77%, Korea KOSPI -2.37%…Memory names particularly weak with Hynix -7% after the South Korea exchange issued an “investment caution” following. Samsung -6%, Nanya -4%…US memory names following early in the pre with SNDK -8% leading the way lower. AI names generally weaker as looks like weaker breadth we’ve seen over the last week or so finally coming for everything.
Government shutdown extends to 34 days, longest was 35 days back in Dec of ’18.
BTC -3%
We’ll hit earnings first - PLTR and then the early AM ones today where calls still ongoing: SHOP, CDW, UBER, SPOT. Then onto the usual and finally some AI Bubble watch items that usually get passed around on red days like today…
Let’s get to it….
EARNINGS:
PLTR -8%: Another beat and raise with broad acceleration (esp U.s. Commercial), record margins, and sizable guide-up for Q4 and FY25
Overall, print looked solid with largest top line beat on record (9% vs average ~3.5%) and revs accelerating to 63% vs 48% last q (street had 50%) and guide implying 61% y/y growth vs street at 44% despite the 6 ppts tougher comps. The one nit I’m hearing is RPO only up 8% q/q , which is a slowdown from 1H pace.
The #s:
3Q Revenue $1.181B, +63% y/y (last q +48% y/y) vs Street ~$1.09B (~+50% y/y); non‑GAAP EPS $0.21 vs $0.17; non‑GAAP operating margin 50.8% vs 45.9%; adj. FCF margin 46% vs 43%.
Q4 revenue mid‑pt $1.329B (+61% y/y) vs Street $1.176B (~+42%); FY25 revenue mid‑pt $4.398B (+53–54% y/y) vs Street $4.139B (~+44%); FY25 adj. OI $2.153B and adj. FCF $1.9–$2.1B both above Street
FY’25 Guidance:
Revenue $4.396–$4.400B (mid‑pt $4.398B), +53–54% y/y vs Street $4.139B (~+44%); Non‑GAAP OI $2.151–$2.155B vs Street $1.924B; Non‑GAAP OM ~48.9% vs 46.5%; Adj. FCF $1.9–$2.1B vs Street $1.933B;
Key Takeaways / Quotes:
U.S. Commercial +121% y/y (29% q/q) on the back of AIP deployments; $1.3B U.S. Commercial TCV in the quarter; FY25 U.S. Commercial guide >$1.433B (≥+104% y/y). Customer count +65% y/y to 530
US Government: Two main drivers of growth for USG; 1) Newer starts are slower to come online due to government shutdown + RiFs and furlough employees reduce working on less urgent contracting. 2) Software contracts already in place will continue to see monetization
Record $2.8B TCV (+151% y/y); RDV $8.6B (+91% y/y; +21% q/q); NDR 134% (+600 bps q/q). RPO $2.6B (+66% y/y, but only +8% q/q)
Management highlighted a booming U.S. demand backdrop and stagnant Europe; U.S. government demand aided by mission programs despite potential shutdown‑related lumpiness
“Customers are converting to larger enterprise agreements in short timeframes, reflecting both the expanding scope of their AI ambitions and the immediate impact our software delivers.” "
“Realizing value from AI in the enterprise requires the elegant integration of LLMs, workflow, and software… And this is only possible with ontology… AI FDE… is unleashing incredible speed and productivity… at one customer, two human FDEs spawned an army of AI FDEs to migrate a customer off their legacy data warehouse in five days… AI Hivemind orchestrates a swarm of dynamically generated agents… integrated with ontology and therefore aware of the context of your enterprise.
“These are arguably the best results that any software company has ever delivered… 77% growth in the U.S.… that growth is being held down by a stagnant Europe… There is a massive part of the AI market that actually cares about value creation, and that’s the part we own.”
Bull vs. Bear Debate
Bulls will say in a history of big beats, this was arguably one of their best and argue Palantir is the category leader in enterprise AI with a uniquely integrated stack (ontology + workflow + agents/AIP) that’s producing measurable ROI and compressing sales cycles. The U.S. Commercial engine is inflecting (+121% y/y), bookings are compounding ($2.8B TCV), top line continues to accelerate despite tougher comps, and profitability is elite (Rule‑of‑40 114%, OM ~51%). Government wins (e.g., Army centralizing on Vantage) provide durable, mission‑critical ballast while Commercial drives upside optionality. On valuation, even bulls have to go out to 2030 to even make some sense of the current price.
Bears mainly focus on valuation risk first: PLTR trading around ~83× CY26E revenue, leaving little room for execution slips or AI sentiment resets. They also flag RPO growth moderation, lumpiness in U.S. Government (and potential shutdown impacts), and questions on GTM durability given reliance on an FDE/services‑heavy model while management reduces sales headcount. International softness (Europe) and the possibility that competitors close the gap with cheaper, “good‑enough” stacks are additional pressure points.
SHOP -4%: Looks solid with beat/raise with leaner opex vs. high expectations
Solid across the board despite high expectations—GMV, revenue, gross profit, and FCF margin all beat; GAAP opex ran lighter than feared. MRR a touch light.4Q guide is above Street (mid high 20s vs buyside at 26% and street at 23%) on revenue and GP growth with lower opex %, and FCF margin guided above 3Q.
GMV +32% and GPV +40% both accelerated despite tougher comps and grew the fastest since Q4 ‘21. Expectations were high here, but not much to dislike as GPV/GMV came even higher than we/buyside expected and think GMV/GPV can continue to accelerate through Q1
3Q25 Results
GMV: $92,013 vs street $88,874 (beat)
Revenue: $2,844 vs street $2,758 (beat)
Revenue Growth: 31.5% y/y vs street 27.6% (beat)
Gross Profit: $1,391 vs street $1,361 (beat)
Gross Profit Growth: 24.4% y/y vs street 21.5% (beat)
GAAP Opex (% rev): 36.8% vs street 38.2% (lower/better; guide was 38–39%)
FCF Margin: 18.0% vs street 17.7% (beat)
4Q25 Outlook
Revenue Growth: mid–high 20s% vs street 23.9% (above)
Gross Profit Growth: low–mid 20s% vs street 21.8% (above)
GAAP Opex (% rev): 30–31% vs street 31.3% (lower/better)
FCF Margin: > 3Q25 (i.e., >18%) vs street 21.7% (in line)